From the list of maps my top four would be the 19th century Alaska Map (Figure 2.1), the map of the forests (Figure 2.3), the map of the villages (Figure 2.4), and the orthographic projection (Figure 2.10).
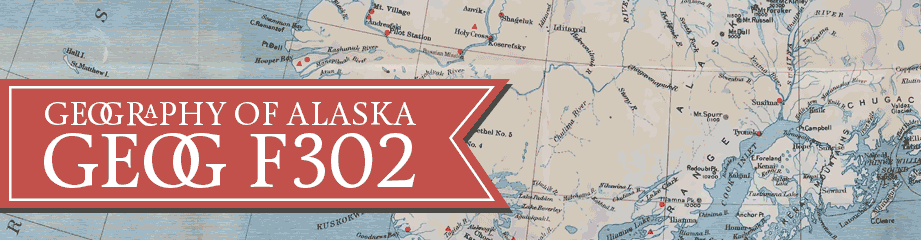
I was impressed at how close the 19th century Harriman Expedition map was considering they were sailing around to gather and process that information. Although it does not give any information to the interior of Alaska, I think the map is relatively close considering the technology they had.
The other two maps that I found interesting were the maps of the villages and forests of Alaska. There were both regional geographic maps since they focused on a single feature. However, these features tell about the of land and the people. Many of my students are from rural areas of Alaska and it is historically interesting to see where villages were formed because of the waterways of the state. Additionally, I am from the interior of Alaska and I am so used to being surrounded by trees. It gives a different perspective to see how much of the state does not have any forestry. By comparing the Harriman Expedition map to the forestry map, it is explains why they labeled “Great Marshes’ as the only indicator of what the land was like. There are no trees for hundreds of miles. These two maps would be very neat to share with my students.
Lastly, I think the orthographic projection gives the best perspective for the scale size of the state compared to other surrounding countries. I like spherical geometry and this map created in a mathematical way. It looks like it could be sketched from the International Space Station. I am curious to the exact process of how this map was made.